How to Build Custom Media Monitoring Dashboards
Learn how to create a custom media monitoring dashboard to track brand reputation, analyze sentiment, and respond to trends effectively.

Want to track your brand's reputation and public sentiment in real-time? A custom media monitoring dashboard is the tool you need. Unlike generic solutions, these dashboards give you tailored insights to manage crises, measure campaign success, and track trends across news, social media, blogs, and more.
Here’s a quick guide to building one:
- Set Clear Goals: Define what success looks like (e.g., increase positive brand mentions by 25%).
- Choose Metrics: Focus on actionable data like sentiment analysis, engagement rates, and share of voice.
- Use Diverse Data Sources: Integrate news outlets, social platforms, blogs, and podcasts for a complete picture.
- Pick the Right Tools: Look for features like real-time updates, multi-channel tracking, and customizable reporting.
- Organize Your Dashboard: Group metrics by goals (e.g., awareness, engagement, reputation) for easy analysis.
- Optimize Regularly: Update filters, add new data sources, and refine widgets to keep your dashboard effective.
Pro Tip: Tools like Media AI can enhance your dashboard by identifying key influencers and automating reporting, saving time and improving accuracy.
Building a custom dashboard ensures you’re always ready to respond to trends, manage crises, and showcase results to stakeholders. Let’s dive into the details!
Media Monitoring Dashboard Basics
What is a Media Monitoring Dashboard?
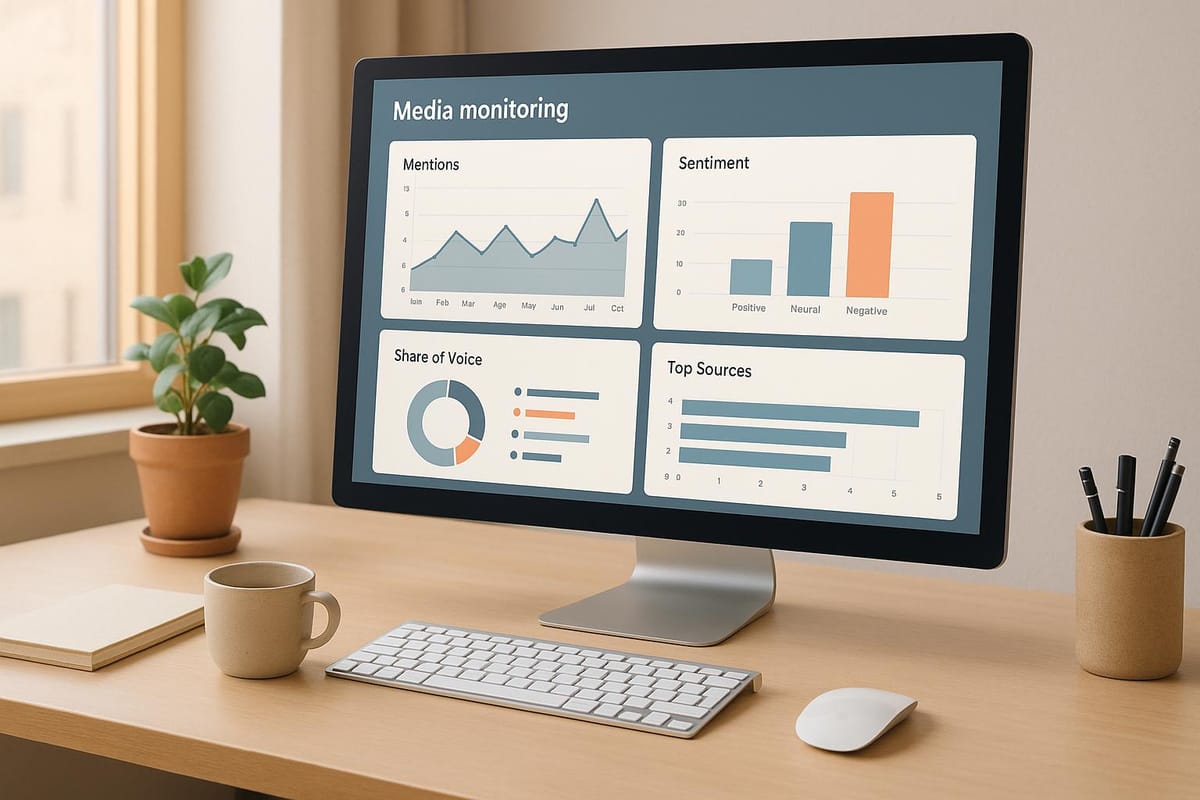
A media monitoring dashboard is your go-to tool for tracking, analyzing, and managing your brand's presence across various platforms. It consolidates data from sources like news outlets, social media, blogs, and even broadcast channels, transforming raw information into actionable insights.
These dashboards provide real-time updates on key metrics such as brand sentiment, share of voice, audience engagement, and demographics. They don't just tell you what’s being said about your brand - they dig deeper into the emotions behind those mentions.
Many dashboards include features like sentiment analysis, which categorizes mentions as positive, negative, or neutral. Some even offer crisis detection capabilities. For example, a whopping 83% of marketers believe social media marketing has boosted their brand exposure, highlighting the value of centralized tools for monitoring and managing brand activity.
Understanding these core functions helps clarify who stands to gain the most from using such dashboards.
Who Needs a Media Monitoring Dashboard?
While PR professionals and agencies are the primary users of media monitoring dashboards, their benefits extend to anyone responsible for brand reputation or managing public conversations. Social media agencies, for instance, depend on these tools to juggle multiple client accounts efficiently. By automating monitoring and reporting, agencies can save up to 10 hours per week.
Startups also find these dashboards invaluable for gaining quick, cost-effective insights into their market position. Freelance PR consultants and marketing professionals use them to craft detailed reports tailored to individual client goals and performance metrics.
Corporate communications teams in established companies rely on dashboards for tasks like competitive analysis and spotting trends. With 88% of consumers expecting a response on social media within two business days, real-time alerts are crucial for maintaining customer satisfaction. Even small business owners can benefit from the basic features of these tools, using the insights to allocate resources wisely and shape their messaging strategies.
Key Data Sources for Dashboards
The effectiveness of a media monitoring dashboard hinges on the quality and diversity of its data sources. A well-rounded dashboard pulls in information from a variety of places:
- News outlets and online publications: This includes everything from major newspapers and trade publications to niche industry blogs and regional news sites, forming the backbone of traditional media coverage.
- Social media platforms: Facebook, Twitter, Instagram, LinkedIn, and TikTok provide insights into engagement through likes, shares, comments, and direct interactions.
- Broadcast media: Television and radio mentions can spark significant online discussions, making them critical data points.
- Blogs, forums, and review sites: These offer unfiltered consumer sentiment, giving you a raw look at what people are saying.
- Podcast platforms: Particularly valuable for B2B brands, podcasts have become an important source of data as they cater to business-focused audiences.
The timeliness and accuracy of your data are key to making your dashboard truly effective. Real-time updates and seamless integration across platforms ensure you get a complete view of your digital footprint, allowing you to respond quickly to trends and developments.
Social Media Monitoring Dashboard - creating one for free
Planning: Setting Goals and Identifying Metrics
Before diving into dashboard creation, it’s essential to have a clear plan. Without specific goals and metrics, even the most visually stunning dashboard risks being reduced to a collection of charts that don’t lead to actionable insights.
Defining Objectives and KPIs
Your dashboard should reflect the larger goals of your PR or marketing campaigns. To get started, ask yourself: What does success look like for your team? Are you trying to boost brand awareness, monitor sentiment during a product launch, or measure engagement across social platforms?
For instance, if you’re launching a new product, your objectives might include securing positive media coverage and increasing influencer engagement. In this case, your KPIs could include metrics like the number of positive mentions, influencer reach, and earned media value. On the other hand, during a crisis, your focus shifts to minimizing negative sentiment and maintaining control of the narrative. Key metrics here might include sentiment scores, the volume of negative mentions, and response time.
Be as specific as possible when setting goals. Instead of saying, “improve brand perception,” aim for something measurable, like “increase positive sentiment mentions by 25% in the next quarter” or “secure 500 high-authority media mentions within the first month of launch.”
Involve stakeholders from the beginning. Whether it’s PR teams, marketing departments, or executive leadership, each group may have different priorities. Use structured interviews or collaborative workshops to gather input and align everyone on what success means.
Choosing Key Metrics
The metrics you choose should align directly with your campaign’s goals. Focus on data that can guide decisions rather than numbers that don’t lead to actionable strategies.
Here are some key metric categories to consider:
- Coverage volume: Tracks how often your brand is mentioned across various platforms and sources.
- Sentiment analysis: Breaks down mentions into positive, negative, or neutral, giving you insight into the emotional tone of the coverage.
- Top sources: Identifies which outlets or journalists are driving the most impactful coverage.
- Geographic trends: Shows where your brand is being talked about, providing location-specific insights.
- Engagement rates: Measures interactions like likes, shares, comments, and click-throughs, which are especially important for social media campaigns.
The priority of these metrics depends on your goals. For brand awareness, focus on volume and reach. If reputation management is your aim, sentiment analysis should take precedence. For campaigns centered on engagement, track audience interactions like shares and comments. Meanwhile, crisis management efforts might zero in on spikes in negative sentiment or coverage volume, while a product launch could emphasize reach and identifying influential sources.
Don’t track data just for the sake of it. Every metric should tie back to a business goal and provide actionable insights. If a metric doesn’t help shape decisions or strategies, it doesn’t belong on your dashboard.
Once you’ve identified the critical metrics, organize them in a way that transforms raw data into meaningful insights.
Grouping Metrics for Better Insights
Organizing metrics by campaign goals - such as awareness, engagement, reputation, and conversion - can turn your dashboard into a powerful decision-making tool.
- Awareness-focused groupings: Combine metrics like total mentions, reach, share of voice, and geographic coverage. Together, these offer a quick view of brand visibility and help identify areas where your presence is growing or declining.
- Engagement groupings: Include data on comments, shares, click-through rates, and social interactions to gauge how audiences are responding to your content.
- Reputation groupings: Focus on sentiment scores, crisis indicators, and response times to monitor public perception and manage crises effectively.
- Conversion-focused groupings: Track metrics tied directly to business outcomes, such as website traffic from media mentions, leads generated from PR efforts, or sales attributed to specific coverage. These insights are especially helpful for demonstrating ROI to stakeholders.
This structured approach helps you identify trends and adjust strategies. For example, if awareness metrics are strong but engagement is low, it might be time to refine your messaging. Or, if negative sentiment spikes in a particular region, you can quickly address the issue and reallocate resources to mitigate the impact.
Tailor your dashboard to its audience. Executives often prefer high-level overviews, like total reach and sentiment trends, while campaign managers may need detailed data, such as source-level engagement metrics and real-time alerts. By grouping metrics thoughtfully, you can deliver the most relevant information to each stakeholder.
With clear goals, carefully chosen metrics, and well-organized groupings, you’re ready to select the tools that will bring your dashboard to life.
Selecting the Right Tools and Features
Choosing the right platform can transform scattered data into actionable insights. The wrong tool? It can leave you drowning in irrelevant information. The right one, however, turns data into decisions that drive meaningful outcomes.
Key Features to Look For
When it comes to media monitoring, the foundation of a strong dashboard lies in its core features. Real-time monitoring is non-negotiable - delayed data means you risk missing critical conversations as they happen. Always opt for platforms that update in real-time.
Another must-have is multi-channel coverage. Your audience is everywhere - traditional media, social platforms, blogs, forums, podcasts, and even broadcast media. A tool that tracks all these channels ensures you don’t miss important trends or discussions.
Advanced filtering capabilities are what separate basic tools from powerful ones. Filters that let you sort by sentiment, geography, language, source authority, and engagement levels help you zero in on what matters most. Without these, you’ll waste time sifting through irrelevant data.
Customizable dashboards are key to tailoring views for different team members. Executives might need high-level summaries, while campaign managers require detailed insights. A flexible dashboard ensures everyone gets the information they need without compromise.
Integration capabilities are also crucial. Your monitoring tool should seamlessly connect with your CRM, social media tools, email marketing software, and analytics platforms. This eliminates manual data transfers and reduces the risk of errors.
Automated alerts are another game-changer. Set specific triggers for things like spikes in negative sentiment, mentions from influential sources, or competitor activity. These alerts keep you informed without overwhelming you with unnecessary notifications.
"Efficient media monitoring begins with selecting the right tools. With so many options available, picking a solution tailored to your needs is essential. Look for platforms that track across multiple channels, provide real-time updates, and offer insightful analytics." – Jessica Perkins, Writer and SaaS Marketing Consultant, Agility PR Solutions
Accuracy in sentiment analysis is critical for monitoring your brand’s reputation. Tools should achieve at least 88% accuracy in sentiment classification. Anything less could lead to misinterpreted data and poor decision-making. Before committing to a platform, test it with real mentions of your brand.
Finally, export and reporting capabilities are essential for sharing insights across teams. Look for tools that offer customizable reports, scheduled delivery options, and the ability to export in formats like PDF, Excel, or PowerPoint.
These features are all embodied by Media AI, which takes media monitoring to the next level. Let’s explore how.
How Media AI Can Help
Media AI doesn’t just monitor media - it bridges the gap between insights and action. While many tools tell you what’s being said, Media AI helps you find out who is saying it and how to engage with them effectively.
The platform’s AI-powered database of over 30,000 journalists and creators transforms passive monitoring into active relationship-building. When your dashboard flags influential coverage or trending conversations, Media AI’s advanced filtering tools make it easy to identify the right contacts to amplify your message or address concerns.
With advanced filtering options, you can narrow down contacts by criteria like beat, publication, follower count, engagement rates, or geographic location. This precision ensures you’re connecting with people who genuinely care about your industry and have the reach to make an impact.
Media AI also integrates seamlessly into your workflow. Its export capabilities allow you to quickly pull contact lists directly from your dashboard, so you can act on PR opportunities without juggling multiple tools.
Keeping your outreach current is effortless with real-time contact updates. Media AI’s database is constantly refreshed, so you’re always working with the latest information. No more bounced emails or missed opportunities.
And with a no-contract pricing model starting at $99 per month for individual databases or $149 for full access, Media AI is accessible for campaigns of any size. You can scale your usage based on your needs without being locked into long-term commitments.
By connecting monitoring insights with PR relationships, Media AI helps you move from strategy to action - fast.
Integrating External Data Sources
Expanding your dashboard with external data sources can make your insights even more valuable. API connections allow for automated data pulls, while CSV imports can handle sources without API access.
To ensure data quality, use automated validation. Set rules for data completeness, format, and logical ranges. For example, if engagement rates exceed 100% or sentiment scores fall outside expected ranges, the system can flag them for manual review.
Data governance policies are critical when working with multiple sources. Establish clear standards for accuracy, update schedules, and access permissions. Organizations that integrate external data effectively see improvements like a 28% boost in forecast accuracy and a 15% reduction in inventory costs.
Real-time integration capabilities ensure your dashboard always reflects the latest information. AI-powered tools can automate the extraction, transformation, and loading of data, reducing manual work while maintaining accuracy. These systems can even identify patterns and handle complex tasks without constant oversight.
Additional data, such as weather reports, economic trends, or industry insights, can provide valuable context. For instance, a spike in negative sentiment about an outdoor event company might align with unexpected storms in key markets.
Start with one high-value data source and expand as needed. This controlled approach ensures your dashboard remains effective while growing in capability. By integrating external data, your platform becomes a powerful tool for unified, real-time insights.
Step-by-Step Guide to Building Your Dashboard
Creating a media monitoring dashboard that delivers actionable insights for your PR strategy involves a structured approach. By organizing data effectively, you can transform scattered information into a tool that supports real-time decision-making.
Setting Up Your Workspace
Start by setting clear goals for your media monitoring efforts. This ensures every step has a purpose and aligns with your objectives.
Create a new dashboard or use an existing template to save time. For instance, Microsoft Fabric offers templates on its GitHub repository that can help you get started quickly.
Next, assign user roles and permissions. Determine who needs full editing access, who should have view-only access, and who will receive automated reports. This step helps secure sensitive data and streamlines collaboration.
Think about your team's workflow when setting up the workspace. Executives might prefer high-level summaries accessible on mobile devices, while campaign managers may need detailed, drill-down views. Setting up tailored dashboards for different user groups can make collaboration smoother.
Finally, link your data sources - such as social media accounts, news feeds, and external APIs. Test these connections early to ensure the data flows seamlessly into your dashboard without gaps.
Once the workspace is ready and data sources are connected, you can start building visual insights with widgets.
Adding and Configuring Widgets
Widgets are the building blocks of your dashboard. Start by adding core PR metric widgets like volume, impact, reach, and EMV. These provide a quick overview of your brand's performance. You can also include widgets to highlight top conversations and messages across platforms, giving a snapshot of what's driving discussions.
Sentiment analysis widgets are particularly useful. Configure them to provide detailed insights into positive and negative messages about your brand. Validate their performance with known examples to ensure accuracy.
Trend visualization widgets can help you track patterns over time, such as mentions, sentiment, and web shares. Set these widgets to match your reporting needs - daily for active campaigns, weekly for ongoing monitoring, or monthly for executive summaries.
Geographic analysis widgets are great for understanding regional performance, especially if your campaigns or products target specific locations.
Benchmark widgets allow you to compare performance across brands, regions, or languages. For example, Pride in London used social listening tools to identify key topics that resonated with their audience, leading to audience growth of 135% in 2013–2014 and peaking at 215% in 2014–2015.
Customize each widget by naming it clearly, choosing the right visualization type, and adjusting metrics and sorting options. Group related widgets together to make the dashboard easier to scan and analyze.
Once your widgets are set up, refine the dashboard by applying targeted filters and date ranges.
Applying Filters and Date Ranges
Filters help you focus on the most relevant data and spot trends as they emerge.
For date range filters, start broad at the dashboard level, then narrow down for specific widgets or groups. This lets you zoom in on particular periods without having to reconfigure the entire dashboard. Historical data can reveal trends, while future date ranges might include scheduled campaigns or content.
Content filters can further refine your view. For instance, filtering by total engagement highlights high-performing content, while geographic filters - like focusing on New York - offer insights into regional performance.
Sentiment and source filters add another layer of detail. During a product launch, positive sentiment filters can showcase success stories, while negative sentiment filters are invaluable for crisis management. Experiment with different filter combinations to uncover the most actionable insights.
Applying filters across the entire dashboard can save time, enabling quick adjustments without editing each widget individually.
Exporting and Sharing Dashboards
A dashboard is only as useful as its ability to communicate insights. Tailor your export formats to suit different audiences. PDFs are ideal for executive summaries and presentations, CSVs work well for analysts who need raw data, and Excel files provide structured data that's easy for non-technical team members to navigate.
Set up automated exports to match your reporting cycles. For example, schedule weekly PDFs for executives, daily CSVs for campaign managers, and monthly comprehensive reports for clients. Automation reduces manual effort and ensures consistent communication.
Control sharing permissions carefully. Create different views for internal teams and external clients. A client-facing dashboard might emphasize positive metrics and growth, while an internal version could include more detailed breakdowns and areas for improvement.
When your monitoring identifies influential coverage or trending topics, tools like Media AI let you pull relevant contact lists directly from the dashboard. This bridges the gap between insights and immediate outreach opportunities.
Finally, document your export and sharing processes. This ensures team members can access insights independently, minimizing bottlenecks and keeping monitoring efforts uninterrupted even when key personnel are unavailable.
Optimizing and Maintaining Your Dashboard
Creating a dashboard is just the beginning. To keep it relevant and effective, you’ll need to regularly refine and adapt it to meet evolving PR goals and deliver actionable insights.
Customizing Dashboards for Specific Campaigns
Once you’ve established the basic structure of your dashboard, it’s time to tailor it for specific campaigns. Different campaigns require different data priorities, and instead of starting from scratch each time, you can use templates and saved views to make adjustments quickly.
For example, during a product launch, you might focus on metrics like volume, share of voice, and sentiment trends. On the other hand, a crisis management campaign would likely prioritize alerts for negative sentiment, response times, and the geographic spread of mentions.
Saved views make it easy to switch between configurations. You could set up daily views for monitoring active campaigns, weekly views for brand tracking, and monthly views for executive summaries. Additionally, audience-specific views can highlight the metrics most relevant to each stakeholder, ensuring everyone gets the insights they need.
Templates also simplify customization for clients. For instance, a tech startup might want to track mentions in developer communities or GitHub discussions, while a retail brand could focus on customer reviews and influencer activity. Pre-configured views are especially helpful for seasonal campaigns, like holiday promotions or industry events, allowing you to pivot quickly when needed.
Using Media AI for Reporting
With your dashboard set up, Media AI can take your reporting to the next level by automating content analysis and streamlining exports. Its AI capabilities identify patterns and trends that go beyond surface-level metrics.
One standout feature is automated content categorization, which tags and organizes articles, posts, and mentions. This eliminates the need for manual sorting and allows you to break down reports by topic, source type, or content category with ease.
Media AI also bridges the gap between insights and action. By identifying trends, you can pull targeted contact lists of journalists or influencers covering your industry, enabling immediate outreach opportunities.
"It's our job to tell a simple story through reporting to our clients. The report is the client's proof that what we are doing is benefiting their business in a positive way."
– Brian Ferritto, Partner, 42connect
Media AI’s sentiment analysis adds another layer of depth, helping you interpret audience reactions and include context in your reports. Automating report generation can align with your communication cycles - weekly reports can focus on short-term trends, while monthly reports provide a broader overview, including competitor benchmarking and campaign performance.
Regular Optimization Practices
Maintaining a dashboard isn’t a one-and-done task. To stay effective, it requires consistent updates and checks. Without this, dashboards risk becoming outdated or irrelevant - one study found that only 14% of self-service dashboards are actively used.
Monthly reviews are a good starting point. Assess which widgets are being used and which aren’t providing value. If certain metrics are ignored, either they need better context or it’s time to replace them. As your needs grow, consider adding new data sources, such as emerging social platforms, industry-specific publications, or new geographic regions.
Quarterly assessments should take a broader view. Are your KPIs still aligned with your business goals? Has your competitive landscape shifted, requiring new benchmarks? For example, McKinsey found that using AI-driven forecasting in supply chain management reduced errors by 20–50%, leading to significant decreases in lost sales and product unavailability. These kinds of insights highlight the importance of keeping dashboards aligned with current strategies.
Feedback from users is another valuable tool. What works for the person who designed the dashboard might not be intuitive for daily users. Pay attention to which sections are most frequently accessed and which export formats are preferred - these insights can guide improvements.
Weekly quality checks ensure everything is running smoothly. Test sentiment accuracy with known examples, remove broken API connections, and update data sources to maintain reliability.
"Effective dashboards should not only present data but also convey the story behind it, guiding users toward making informed decisions without overwhelming them with details."
– UX Design World
Lastly, don’t overlook security. Regularly updating your dashboard’s security protocols protects sensitive data and builds trust. These updates are crucial for safeguarding competitive intelligence and ensuring compliance with privacy standards.
Think of your dashboard as a living tool that evolves with your PR strategy. By committing to regular maintenance and updates, you’ll ensure it continues to provide value as your business grows and adapts. Combined with proactive monitoring and reporting, these efforts will help you maintain a competitive edge in the PR landscape.
Conclusion: Key Takeaways for Building Effective Dashboards
Creating impactful media monitoring dashboards hinges on setting clear objectives, selecting the right tools, and maintaining ongoing refinement. Once your objectives are defined, the next step is to choose tools that align with your strategy and bring it to life.
Pick your tools carefully, prioritizing platforms that offer broad coverage and AI-driven insights. Real-time data and multi-channel tracking are no longer optional - they’re essential. For instance, about 65% of PR professionals now rely on AI as part of their workflow. Tools like Media AI excel at processing massive datasets, uncovering trends, and flagging potential issues that might escape human attention. Look for features such as real-time monitoring, advanced sentiment analysis, and customizable reporting to ensure your tools meet your specific needs.
Focus on quality over quantity by using targeted keywords and filters. This approach minimizes data overload and ensures your insights are meaningful. Remember, dashboards aren’t static; they need to evolve. Regular updates and adjustments are crucial to keeping them relevant.
Customize your dashboard to suit its audience. For example, C-suite executives might need concise trend summaries, while PR teams benefit from detailed sentiment analysis and real-time notifications. Tools like Media AI simplify this process with advanced filtering and sentiment analysis, allowing you to create tailored views without the hassle of manual sorting.
By applying these strategies and leveraging AI-powered tools like Media AI, you can turn raw data into actionable insights, staying ahead of trends and ready to seize opportunities. As Richard Bagnall from CARMA aptly puts it, "AI tools can do the heavy lifting, but they can't do the thinking for you. They can't give you the relevance, the context, or the critical thinking that you need to do".
"A dashboard is only as powerful as the insights drawn from it. That means committing to turning data into directions. The best custom dashboards don't just show you what's happening; they help you decide what to do next." – Chris Ferris, PhD, Senior Vice President of Digital Strategy, Pierpont
When you integrate these principles into your dashboard strategy, you transform it from a passive tool into an active driver of decision-making in today’s fast-paced PR environment.
FAQs
What are the benefits of using a custom media monitoring dashboard instead of a generic solution?
Custom media monitoring dashboards offer tailored insights designed to align with your specific PR and marketing goals. Unlike generic tools that often provide cookie-cutter data, these dashboards give you the ability to visualize and analyze information in ways that directly support your unique objectives. This makes it easier to track your progress and spot new opportunities.
Another key advantage is their flexibility. These dashboards can grow with your needs, incorporating new data sources as your strategy evolves. This adaptability ensures your monitoring efforts stay relevant and effective, no matter how your goals shift. Plus, they deliver precise, actionable insights, enabling quicker decision-making - whether you're responding to trends or addressing potential crises.
By cutting out unnecessary clutter and focusing on what truly matters to your organization, custom dashboards not only streamline workflows but also help allocate resources more effectively. In a fast-changing media environment, they provide the tools you need to stay ahead of the competition.
How can I keep my media monitoring dashboard accurate and relevant over time?
To keep your media monitoring dashboard working effectively, make it a habit to update your keywords, sources, and KPIs regularly. Media trends shift, and your goals might evolve, so staying on top of these changes helps you gather the most relevant information while cutting out the clutter.
AI-powered tools like Media AI can simplify the process by automating data collection and analysis. This allows you to track accurate, real-time results without the manual effort. Taking time to periodically review and fine-tune your dashboard ensures it stays aligned with your PR and marketing objectives.
What key features should I consider when choosing tools to create a media monitoring dashboard?
When choosing tools for your media monitoring dashboard, focus on features that deliver extensive coverage across various media channels, real-time updates, and AI-driven tagging to organize content quickly and effectively. It's also important to select tools that include customizable alerts and comprehensive reporting to help you stay on top of trends and make informed, data-backed decisions.
Consider platforms that let you manage multiple campaigns from a single interface, automate routine tasks, and offer detailed analytics. These features ensure your dashboard provides meaningful insights aligned with your PR and marketing objectives. For PR professionals and agencies, platforms like Media AI stand out by offering advanced tools designed to simplify media tracking and enhance collaboration.